
What is Hypothesis Testing?
I was helping someone with her introduction to statistics class when the question come up. The literal meaning is easy to understand: you want to test whether your hypothesis is correct or not, but surprisingly not a lot know what is being done for that purpose.
I remember the first time I learned about hypothesis testing. It was some time in the second year of my undergraduate degree in a class of bio-statistics. What I extracted from then was only the algorithm to hypothesis testing:
- Chuck in numbers to a formula, get the value x,
- Check x in a certain distribution probability table,
- Translate it to its p-value, and
- Reject null hypothesis if p-value is below 0.05.
I know how to do it up to that point, but I have absolutely no idea what I am doing there. What is p-value, what are those tables, why 0.05? Only later did I find out that a lot of people who are not mathematically-learned also know about hypothesis testing up to this point.
Below were some points I taught other people who are struggling with their introductory statistics class. Hopefully I am right, else that means I taught some people wrong.
Let’s use a simple example: a machine is said to be able to produce on average 25 unit/hour the product Z. You are contesting this null hypothesis by raising the alternative hypothesis that it is impossible the machine Y produces on average 25 unit/hour the product Z. The hypothesis declaration would look like this:
Null hypothesis: Average Z production is 25 unit/hour
Alternative hypothesis: Average Z production is not 25 unit/hour
By declaring the underlined part in the alternative hypothesis, you are imposing a two-tailed hypothesis test against the null hypothesis, effectively saying that the average Z production is more or less than 25 unit/hour. It is also possible to impose a one-tailed hypothesis test¹ against the null hypothesis by saying that the average Z production is more than 25 unit/hour or less than 25 unit/hour. In any case, you will only be testing the hypothesis against the null hypothesiswhatever the alternative hypothesis is.
To test your hypothesis, you note the amount of Z produced each hour for 10 hours. The data is:
29 25 26 34 33 23 35 29 27 31
It is easy to see in a single glance that the average number of Z produced would not on average be 25. You can say by that alone that the null hypothesis is wrong, but how can you be really sure of that? The statistics tests help you to calculate the probability of the empirical data happening should the null hypothesis is correct.
Here we will be using a one sample Student’s t-test as the test to measure the said probability². We can calculate this easily in R language using the code:
# Input the data
> data = c(29, 25, 26, 34, 33, 23, 35, 29, 27, 31)

# Do two-sided hypothesis testing using one sample t-test,
# against the null hypothesis that the actual mean is 25
> t.test(x = data, alternative = "two.sided", mu = 25)
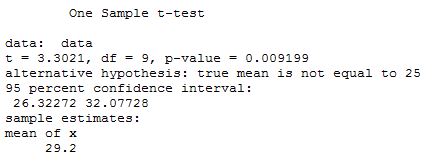
The result will be similar to what can be seen on the screenshot above. Some important information from the screenshot are:
- The t-statistic is 3.3021. This is the statistic that we calculate from the t-test formula. Before computer took over, statistician would translate this value into a probability using a pre-computed table of t-statistic against probability in their respective degree of freedom.
- Degree of freedom is 9, and is something you do not need to understand to use correctly. It is approximated here as 9 using the formula df = n - 1. A t-statistic can show different probability in different degrees of freedom.
- The p-value, as can be seen in the image is 0.009199.
A two-tailed test with a significance level of 0.05 will need a p-value of 0.025 or lower to reject the null hypothesis. Our empirical p-value is lower than that, so we can reject the null hypothesis and say that the true average Z production is not 25 unit/hour. When the p-value is higher than 0.05, we say the data is not enough to reject that the true average Z production is 25 unit/hour.
The algorithm to hypothesis testing ends there.
There is one point I still want to make: in this example case, our conclusion is correct (i.e., logically, if it is not right, then it can only be wrong). But rejecting the null hypothesis does not necessarily mean the alternative is true.
Let’s see it this way: in Student’s t-test, the formula we use to get the t-statistic is:

It is a formula to get the probability of seeing the sample mean xbar when the population mean (or, null mean) is a certain value of µ0. The bottom part is the standard error, which is the standard deviation of the sample³, and we will leave it at that for now.
This is the point when I said you are only testing against the null hypothesis. You only checked for the probability of getting your data should the null hypothesis be true. The question you ask in the test above is basically:
What is the probability of getting sample mean 29.2 when the data come from a distribution with a true mean of 25?
As we saw before, the p-value we get from our data is around 0.0092. It is ~0.1% possible to get a sample mean 29.2 when the population mean is 25 (and, when the standard error is 4.2).
Would we say that it is likely our data come from a distribution with a true mean of 25?
People generally use 0.05, or 5% probability, as the cutoff point to say that the probability is highly unlikely, but that is it. The value 0.05 is just low enough to say it is impossible, and high enough to be achieved easily with the number of sample taken back in the days when they developed statistical hypothesis testing.
The cutoff point 0.05 is arbitrary with not much meaning other than being the standard, and in fact it is too much used that people are abusing the value too much in statistical hypothesis testing. The p-value being lower than 0.05 does not say that the null hypothesis is wrong, it is just that it would be unlikely enough to come from that. In fact, showing the actual p-value might make it more quantifiable for other people.
You can change the hypothesis test to be:
Null hypothesis: Average Z production is 25 unit/hour
Alternative hypothesis: Average Z production is 35 unit/hour
And you will do necessarily the same thing as with the previously shown hypothesis test, while getting the exact same p-value as before. Here, it is easier to see that rejecting the null hypothesis does not necessarily mean the alternative is true. It is still ~0.1% possible the true average Z production is 25 unit/hour given the data, but it does not say anything about the probability of the average Z production being 35 unit/hour.
So, how do you check whether the average Z production is 35 unit/hour or not? That is the task of another bout of hypothesis test.
I would stop there for now.
Thank you for reading this article! Do ask me if anything is still confusing, and correct me if something is wrong.
Notes:
¹ Generally you use two-tailed test. You can use one-tailed test if the proper background knowledge states that the alternative can only go one way and not the other. More commonly, a one-tailed test is done after knowing the direction from the resulting value in a two-tailed test with significant p-value.
² Why we use Student’s t-test here is because the data is approximated to come from a t-distribution, which is a fatter normal distribution to account for us not knowing the population variance of the object the data is sampled from. The mathematics is too involved here to explain in the same post, so stay tuned for more!
³ Standard error is used here because we do not know the standard deviation of the population distribution, which we assume to be normal. This is a thing when we approximate normal distribution using t-distribution.